In the competitive landscape of the restaurant industry, understanding the intricacies of supply chains is crucial for success. Traditional methods often fall short, leading to inefficiencies and missed opportunities. BigQuery Graph offers a solution by enabling the creation of digital twins that provide real-time insights into supply chain dynamics.
The Challenges of Growth
As restaurant chains expand, they face unique challenges that traditional spreadsheet methods cannot adequately address:
- The bullwhip effect: Minor fluctuations in demand can lead to significant inventory issues upstream.
- SOP drift: Small deviations from standard operating procedures can undermine brand consistency.
- Food safety risks: A single contaminated ingredient can create widespread risk across the supply network.
- Maverick spending: Unapproved purchases by local managers can lead to significant financial losses.
Understanding Digital Twins
Digital twins are virtual representations of physical systems that allow for more insightful data analysis. The shift from traditional relational databases to graph-based models is essential for capturing the interconnected nature of supply chains. This transition can significantly reduce the complexity of data management and enhance operational awareness.
Utilizing BigQuery Graph
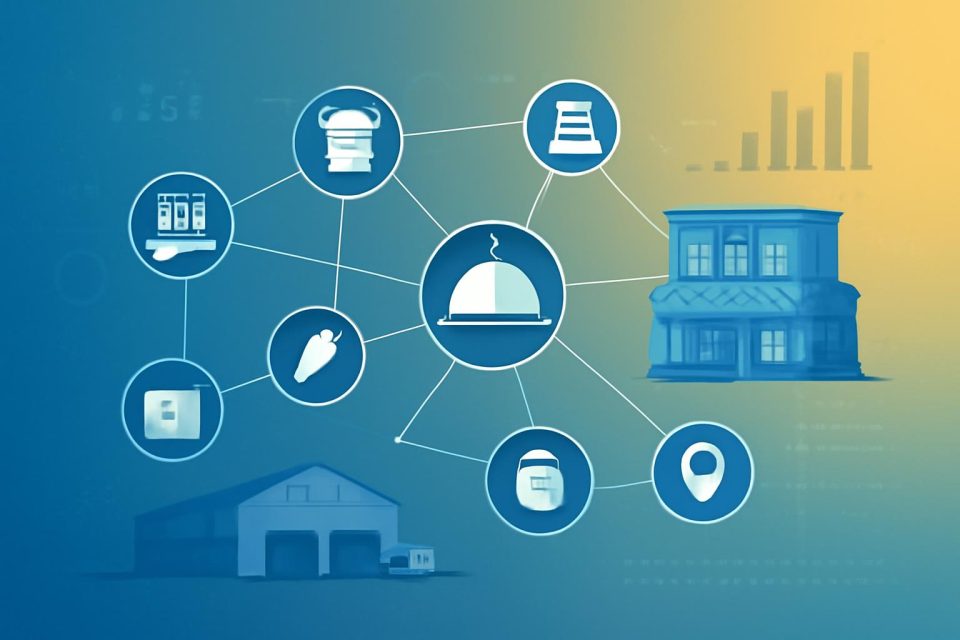
BigQuery Graph enables the construction of a digital twin of a restaurant's supply chain directly within existing data platforms. By representing physical entities—such as items, recipes, and locations—as a graph of nodes and edges, businesses can gain deeper insights into their operations.
Defining Relationships
Creating a Graph View over existing tables allows businesses to define how data elements relate to one another without migrating to a new database. This semantic layer is critical for effective data querying and analysis.
Enhancing Operational Precision
Implementing a graph model transforms daily operations by shifting from reactive to proactive management:
- Surgical recalls: In the event of a food safety issue, businesses can quickly identify affected menu items and locations.
- Weather risk analysis: During severe weather events, businesses can visualize the impact on supply routes and adjust logistics accordingly.
Executing Graph Queries
Graph Queries simplify data analysis by allowing users to explore complex relationships easily. For instance, querying to find all locations handling a specific ingredient can be done efficiently using graph query language.
Best Practices for Digital Twins
To maximize the benefits of a digital twin, businesses should adhere to the following principles:
- Focus on structure: Use graphs to represent relationships while maintaining daily operational data in relational tables.
- Data integrity: Invest in data engineering to ensure strong connections within the graph.
- Metadata utilization: Capture important information, such as shipping costs, directly on graph edges to enhance model functionality.
Conclusion
The restaurant industry is evolving beyond traditional data management methods. By leveraging BigQuery Graph to create digital twins, businesses can gain valuable insights and improve their operational strategies. Transitioning from a list-based approach to a graph-based model allows for a more connected and responsive supply chain management.